LeTommy bookmarks
LeTommy bookmarks
Tag cloud
Picture wall
Daily
RSS Feed
Login
Delete
Set public
Set private
Remember me
Picture Wall - 14 pics
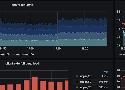
Loki v2 Web Analytics Dashboard for NGINX dashboard for Grafana | Grafana Labs
How To Forward Logs to Grafana Loki using Promtail | ComputingForGeeks
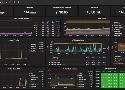
A Guide to Monitor Linux Server using Prometheus and Grafana
How To Install Prometheus with Docker on Ubuntu 18.04 – devconnected
Prometheus Monitoring with Grafana - Java Mastermind
Capabilities - User manual · Wazuh 4.0 documentation
GitHub - brotandgames/ciao: HTTP checks & tests (private & public) monitoring - check the status of your URL
GitHub - statping/statping: Status Page for monitoring your websites and applications with beautiful graphs, analytics, and plugins. Run on any type of environment.
Getting Started [7.9] | Elastic
GitHub - deviantony/docker-elk: The Elastic stack (ELK) powered by Docker and Compose.
Make Container Management Easy With Cockpit - Linux.com
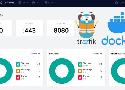
GitHub - vegasbrianc/prometheus: A docker-compose stack for Prometheus monitoring
Ultimate Docker Home Server with Traefik 2, LE, and OAuth / Authelia [2020]
How To Use Logstash and Kibana To Centralize Logs On Ubuntu 14.04 | DigitalOcean
Fold
Fold all
Expand
Expand all
Are you sure you want to delete this link?
The personal, minimalist, super-fast, database free, bookmarking service by the Shaarli community